
Imagine we have a time machine that allows us to see the outcome of medical interventions without actually doing them. We can test hundreds of possibilities and based on these tests we decide the optimal and personalized intervention for the patient. This time machine is called a digital twin. It is a digital replica of physiological processes inside the human body that allows us to visualize the effects of medical interventions like giving a drug, doing surgery, even creating a replica of the patient’s organs like their heart for example.
Digital twins have been around for decades. It is a concept that comes from engineering. We create a digital replica of the machine we have built. When something goes wrong, we can test possible solutions on the digital twin before applying it in reality. This came in handy when an air purifier went down during the Apollo 13 mission in the 1970s. So engineers on Earth tested how astronauts on board Apollo 13 could build a new air purifier with the help of the machine’s digital twin.
Creating a digital twin of the human body means reducing negative and sometimes deadly outcomes in healthcare. It also means creating personalized treatments. So let’s talk about that with the help of a case study:
Case Study Sepsis:
A 49-year-old male with severe abdominal pain, vomiting, and fever. Ultrasound confirmed acute cholecystitis. He receives antibiotics and is scheduled for surgery. Two days after the surgery, the patient developed tachycardia and hypotension (low blood pressure), and O2 saturation rates dropped. Supplemental oxygen is administered. He received a new broad-spectrum antibiotic. His new lab work showed high levels of lactate and inflammation markers. The next day he develops acute renal failure and needs renal replacement therapy. He also has persistent hypotension that requires vasopressors in addition to fluid resuscitation. Two days later, his condition worsens. He has disseminated intravascular coagulation (DIC) and acute respiratory distress syndrome (ARDS). He is admitted to the ICU. There he is connected to a ventilator while receiving continuous renal replacement therapy. Three days later, he dies of multiorgan failure.
This case is not a rarity. It is a common complication after cholecystitis surgeries. Sepsis is defined as life-threatening organ dysfunction caused by a dysregulated host response to infection. Existing scoring systems help assess the likelihood of someone dying of sepsis. They don’t provide actionable measures that might change the outcome of the illness. A digital twin of the same patient, which has been fed all the information we have about him and updated regularly with all the changes that are happening to him, would allow us hypothetically to test alternative personalized measures that might work better for this particular patient and lead to a better outcome.
At the Mayo Clinic, researchers developed a digital twin model that predicts the response of patients within 24 hours of sepsis. The study compared the output in the digital patient with the real patients after they have been admitted to the ICU. The model was based on acyclic graphs. An acyclic graph is a type of graph in which there are no cycles, meaning there’s no way to start at a node and follow a path that eventually loops back to the starting node. Think of it as a family tree. In a family tree, individuals are represented as nodes, and the edges are the relationships (parent-child relationships, to be precise). The direction of the relationship is clear: from parent to child. You can follow the tree from the ancestors down to the descendants, but you can’t go back in time from a child to an ancestor and loop around (since a child cannot be a parent of their ancestor). Here is a picture of the graph they created:
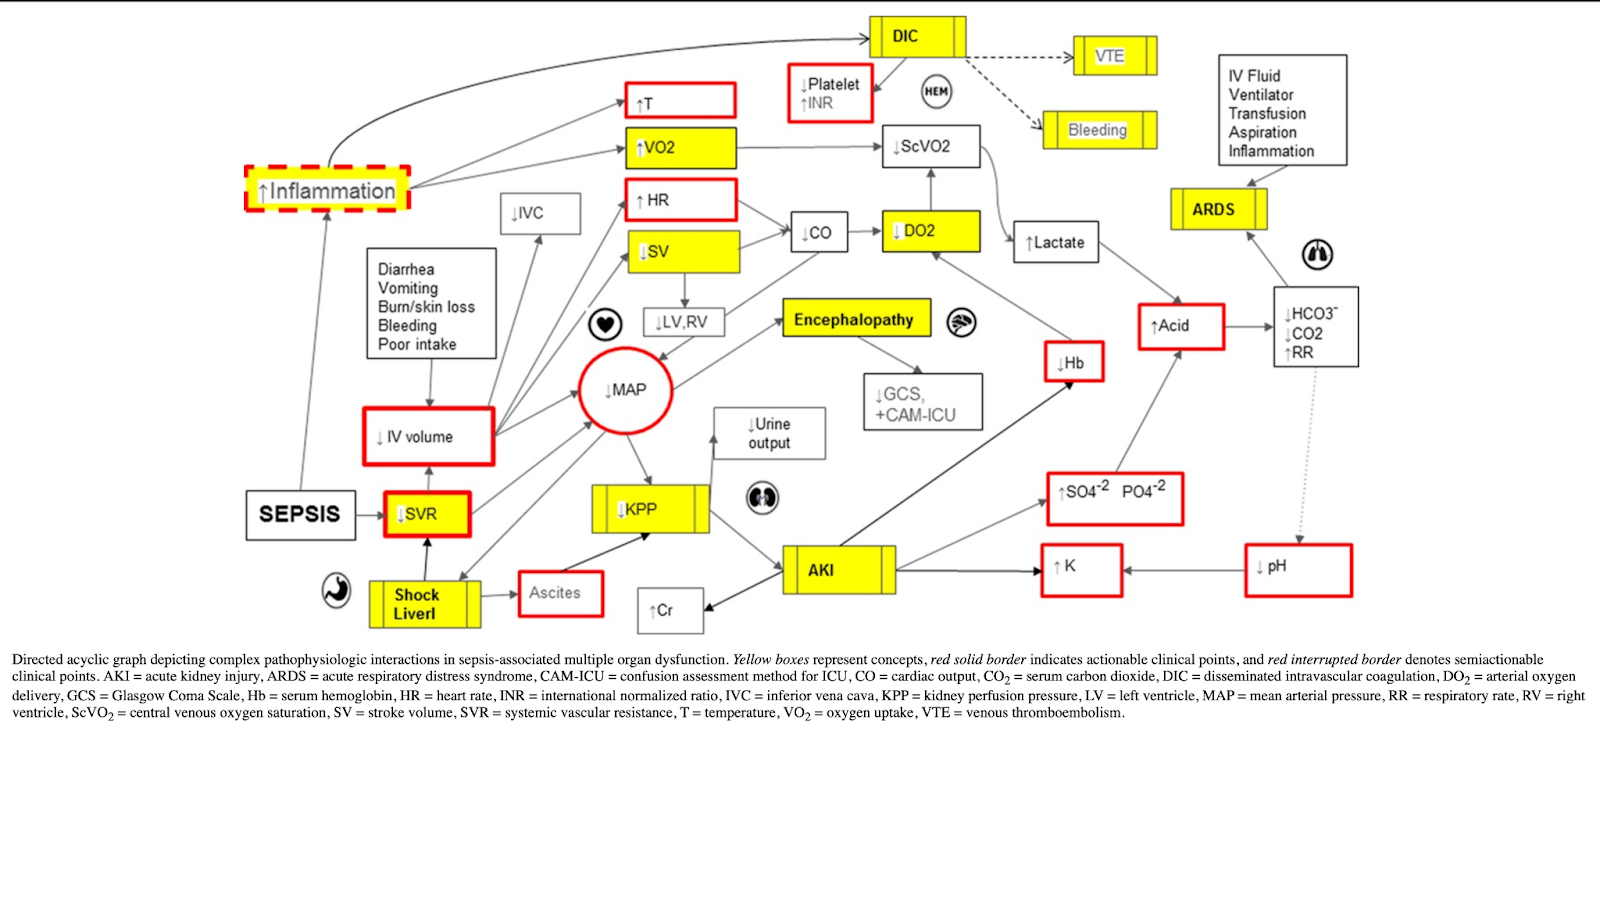
Data from electronic health records (EHR), including demographic measures and clinical markers such as cardiovascular, neurologic, renal, respiratory, gastrointestinal, inflammatory, and hematologic, were part of the assessment. By updating the changes in the patient’s clinical assessment and/or adding interventions like fluid resuscitation or antibiotics, we can see the changes in the outcome in the digital twin of the patient. You can see a video of how the system works at this link:
https://links.lww.com/CCX/A410
Clearly a lot of effort and sweat have been wasted in developing this system. That’s why I would like to acknowledge the effort and the hard work that has been put in building this system (Many thanks for all the authors in the study for sharing their knowledge and hard work: Lal, Amos MBBS; Li, Guangxi MD; Cubro, Edin MSc, MBA; Chalmers, Sarah MD; Li, Heyi MD; Herasevich, Vitaly MD, PhD, FCCM; Dong, Yue MD; Pickering, Brian W. MB, BAO, BCh, FFARCSI; Kilickaya, Oguz MD; Gajic, Ognjen MD, MSc, FCCP, FCCM).
So, how good was the system in predicting the outcomes of the real patients?
The findings showed that the digital twin model could predict the response to specific treatments with varying degrees of accuracy. The agreement between the observed versus expected response ranged from fair (kappa coefficient of 0.41) for the primary response to good (kappa coefficient of 0.65) for the secondary response.
So, what does this really mean? In the following paragraph, I will explain what a kappa coefficient is, how to interpret the results, and what primary and secondary responses are. You can skip this paragraph if you are not interested in that detail.
If you want a shorter version of the explanation, here it is: The kappa coefficient compares your findings to chance. If it is 0, then your findings are as good as chance. If it is higher, then it is better than chance.
The primary response is what we aim to achieve. The secondary response is an add-on.
Now, here is the detailed and more professional explanation:
The kappa coefficient, or Cohen’s kappa, is a statistical measure used to evaluate the agreement between two raters (or sets of data) who are independently classifying items into categorical scales. It is especially useful in situations where the agreement could happen by chance. The kappa coefficient corrects for this chance agreement and provides a more accurate assessment of the reliability of the classifications.
The value of the kappa coefficient ranges from –1 to 1, where:
- 1 indicates perfect agreement between the two raters beyond chance.
- 0 indicates that the agreement is exactly what would be expected by chance.
- Values less than 0 suggest less agreement than expected by chance, which is a rare situation in practice.
- Values between 0 and 1 indicate varying degrees of agreement beyond chance, with higher values representing stronger agreement.
To help understand what a kappa coefficient is, consider this short story:
Imagine you’re at a dance competition where two judges are scoring dancers on their performances. Each judge decides independently whether a performance is “Excellent,” “Good,” or “Needs Improvement.” At the end of the competition, you want to understand how well these two judges agree on their ratings for each performance.
However, simply comparing their choices directly might be misleading because, by chance alone, they might agree on some performances (imagine if they both tend to be generous or harsh in their judgments). So, you need a method to measure their agreement that accounts for these chance agreements.
Enter the kappa coefficient, which acts like a sophisticated scorekeeper. It not only observes when the judges agree but also considers the likelihood that they agreed by mere chance. If the judges were randomly assigning ratings without watching the dances, they would still achieve some “agreements” just by coincidence. The kappa coefficient adjusts for this randomness.
If kappa equals 1, it’s as if both judges have a telepathic connection, always scoring each performance identically, far beyond what luck could explain. If kappa is 0, it means any agreement they have is exactly what we’d expect by chance; it’s as if they’re not even watching the same performances. If kappa is negative, it suggests that the judges are somehow in disagreement more often than we’d expect by mere chance, almost as if one judge always zigs when the other zags, which would be quite an unusual situation in practice.
The kappa coefficient acts like a truth serum for the judges’ agreement, filtering out the noise of random chance and revealing the real harmony (or discord) in their decisions.
What is a primary and secondary response?
“Primary response” and “secondary response” refer to the outcomes or effects observed in patients following medical interventions, as predicted by the digital twin model compared to the actual outcomes observed in real patients.
Primary Response:
The primary response to an intervention is the direct, immediate effect expected as a result of a specific medical treatment or action. It is the main outcome that the treatment is intended to achieve. For example, in the case of administering vasopressors to a patient with sepsis-induced hypotension, the primary response would be an increase in blood pressure to targeted levels.
Secondary Response:
The secondary response is an additional or ancillary effect of the treatment that is not the direct target of the intervention but often occurs as a consequence of the primary action or as a side effect. Secondary responses can be beneficial, neutral, or even harmful. Continuing with the vasopressor example, a secondary response could be a change in heart rate or an improvement in kidney function due to better blood perfusion. Secondary responses might not always be anticipated but can provide valuable information about the patient’s condition and the treatment’s broader effects.
Let’s get back to the findings:
In the context of the study on the digital twin patient model for predicting the response to treatments in sepsis patients, the kappa coefficient was 0.41 for the primary response. It indicates fair agreement between the observed and expected responses to treatment interventions. This suggests that the digital twin model was somewhat effective in predicting the primary response to treatments but not highly reliable. There is room for improvement in the model’s predictive accuracy for primary responses.
The kappa coefficient for the secondary response was 0.65. This indicates good agreement between the observed and expected responses. This higher kappa value suggests that the digital twin model was more accurate in predicting secondary responses to treatments, showing a good level of reliability beyond chance agreement.
Considering that the study was published in 2020 (before we had tools like Chat-GPT) and considering the years it took to develop the system and recruit patients, I feel very optimistic that the concept of a digital twin applied to patients with sepsis will improve significantly. While it’s premature to say whether it will predict the exact same results as real-world interventions, it’s quite obvious that LLMs like Chat-GPT, Gemini, Claude3, and others are becoming more accurate and more powerful and can be utilized to further the development of digital twins, potentially helping to save lives.
Resources:
[1] A. Lal et al., “Development and Verification of a Digital Twin Patient Model to Predict Specific Treatment Response During the First 24 Hours of Sepsis,” Crit. Care Explor., vol. 2, no. 11, p. e0249, Nov. 2020, doi: 10.1097/CCE.0000000000000249.
[2] M. Singer et al., “The Third International Consensus Definitions for Sepsis and Septic Shock (Sepsis-3),” JAMA, vol. 315, no. 8, pp. 801–810, Feb. 2016, doi: 10.1001/jama.2016.0287.
https://jamanetwork.com/journals/jama/article-abstract/2492881
Leave a Reply